Anime Walked
Process Summary
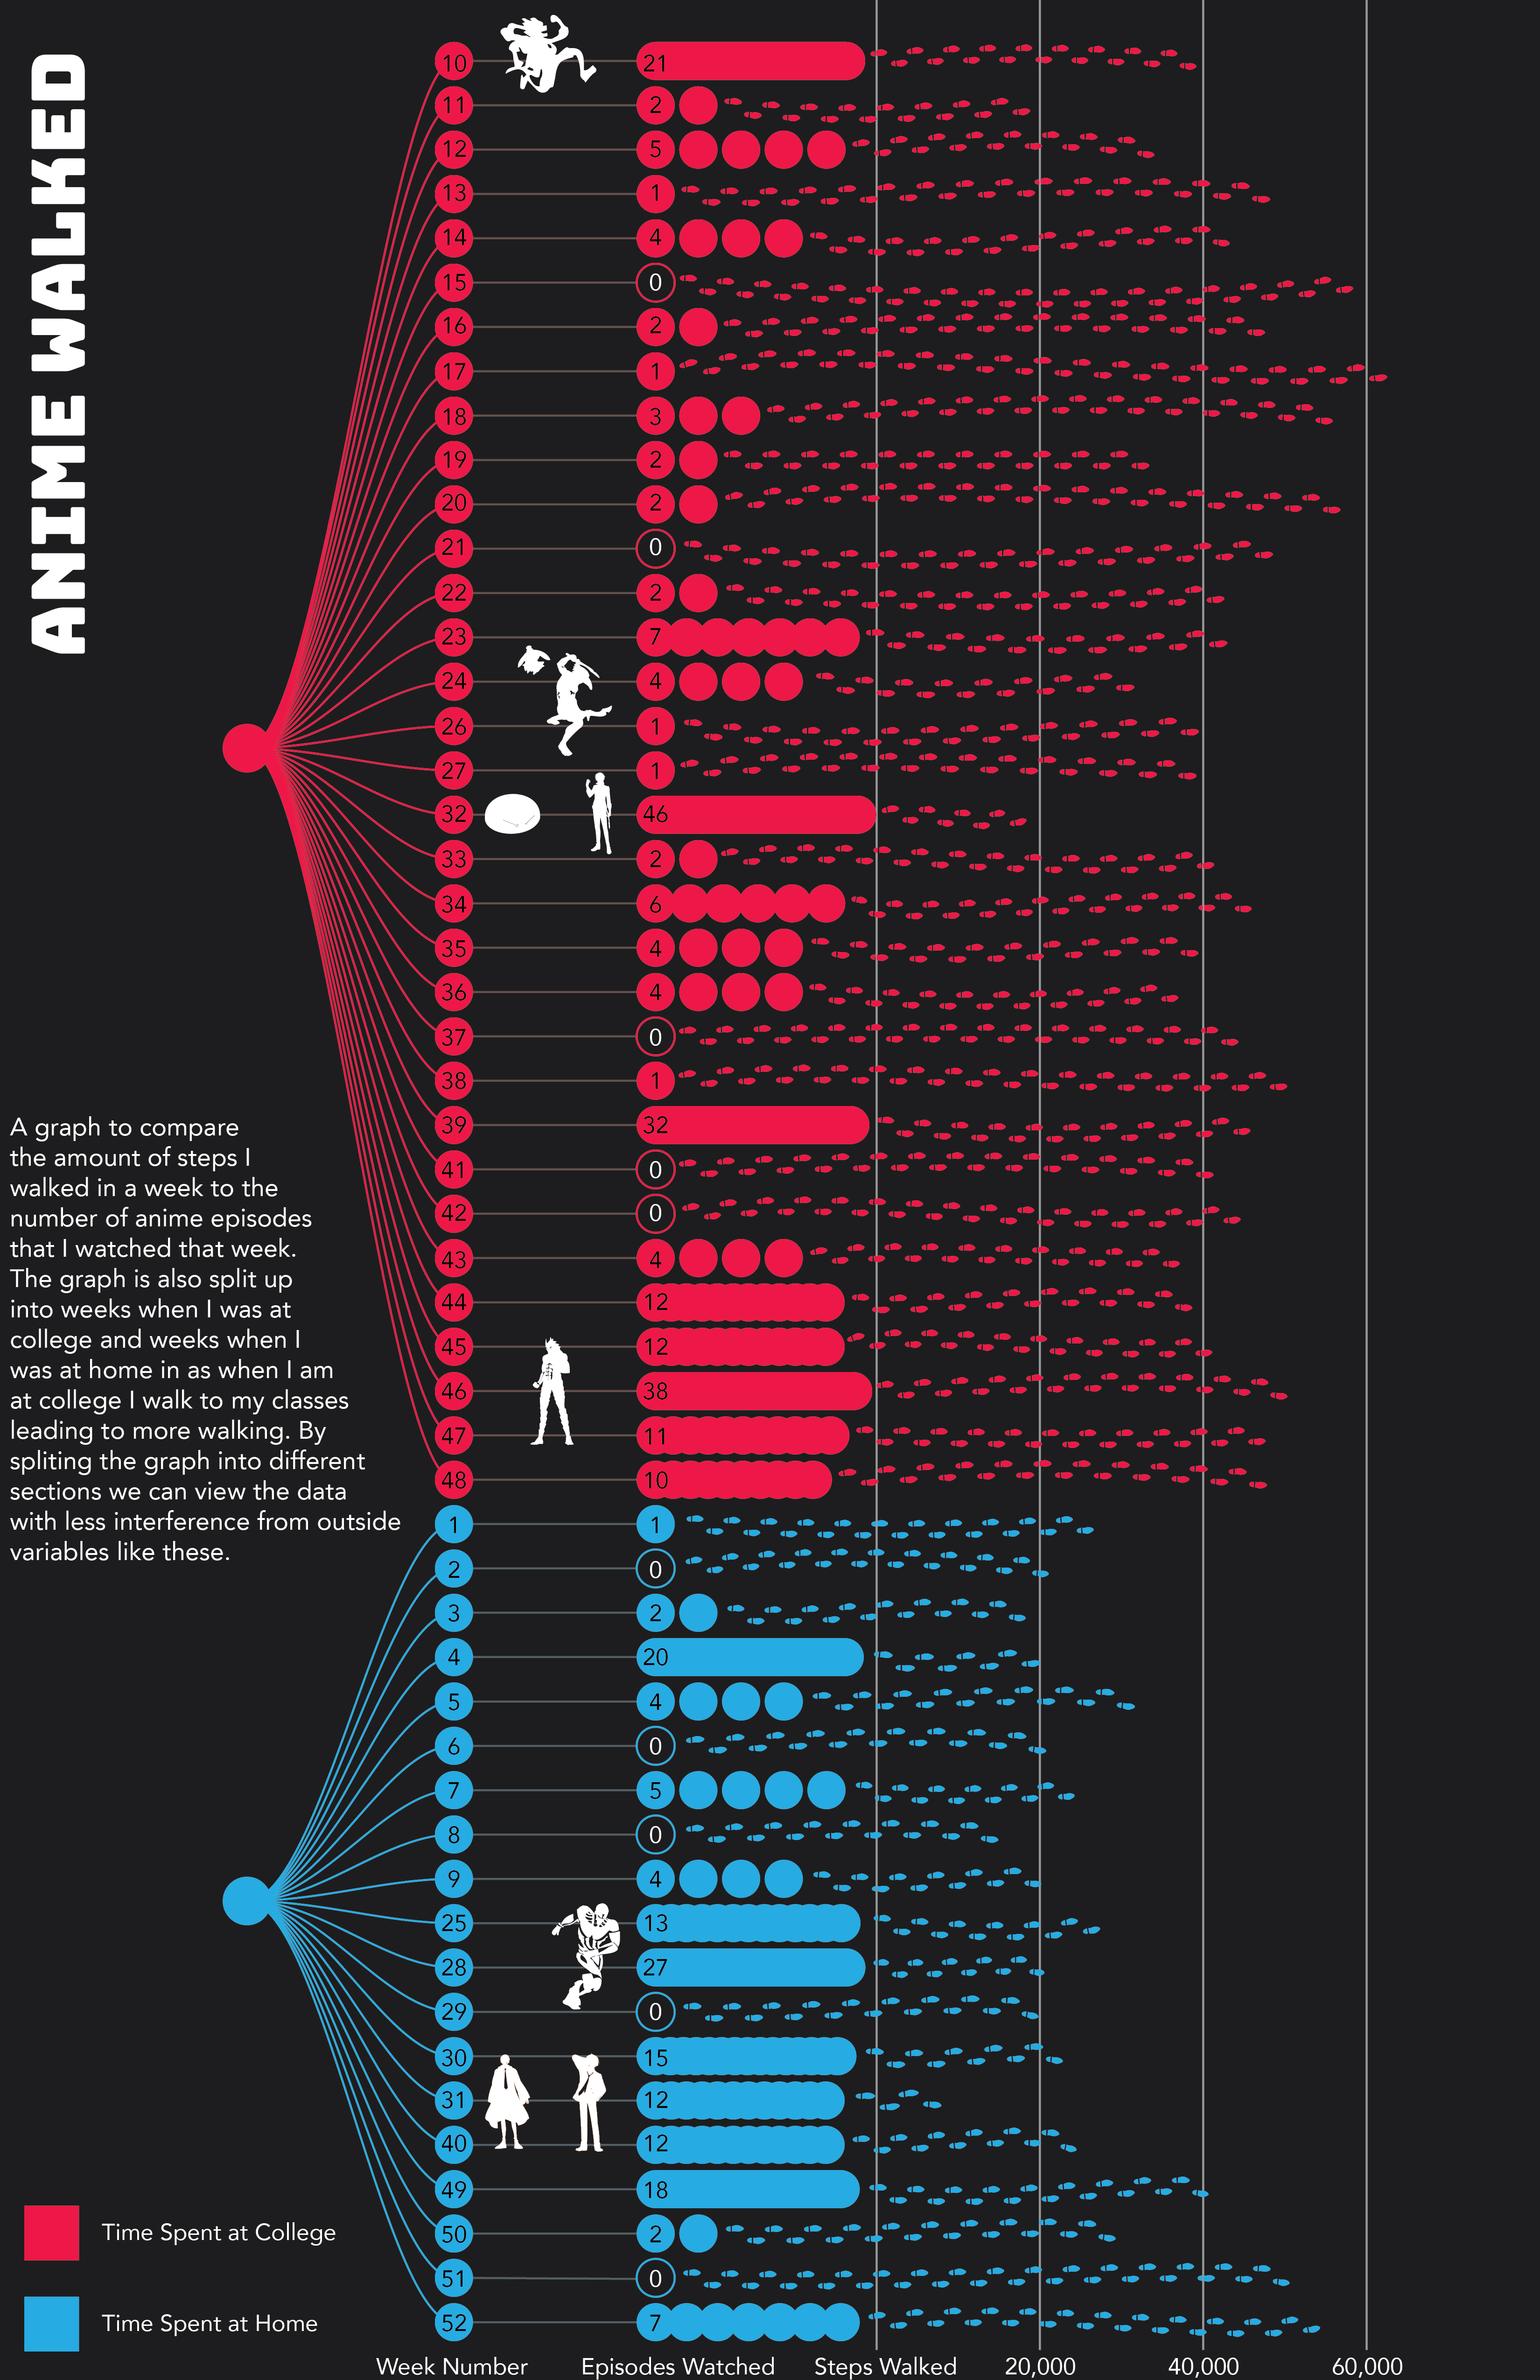
This project involved designing a data-centered visualization exploring the relationship between the number of anime episodes I watched per week and the number of steps I took over the course of a year. I collected step-count data from my phone and weekly viewing data from my streaming service, then evaluated multiple graph types before selecting the most effective visualization for the final poster. After identifying a discrepancy between weeks spent at home and weeks spent at college, I separated the data into two sections to more clearly communicate the differences and designed icons to represent the anime series watched each week and the visualization of the graph